As the SQLDeveloper 1.5.3 version has been released there have been some bug fixes to the User Defined Reports area.
I decided to create a new version of my old Perl v$session_longops monitor that I wrote about here.
This new improved version runs as a Used Defined Report inside of SQL Developer. Here is how to get it running:
Create a new Report
In SQLDeveloper,
• Select View->Reports
• Right click on the User Defined Reports folder and select Add Report.
• Enter Name: Long Operations Graph
• Select Style plsql-dbms_output from the dropdown
• Enter Description: A visual representation of currently active Long Operations.
• Enter the SQL for the report. Source code is available here: SQLD-LongOps-HTML.sql
Here is an example of how the screen should look when you are done (click to enlarge):
• Select Apply button.
Run the User Defined Report
• Select View->Reports
• Expand the User Defined Reports folder.
• Select the Long Operations user defined report.
• Select the Data Source for the report.
• Select "Run Reports" icon or select Refresh Rate.
• Report will execute and show any long operations.
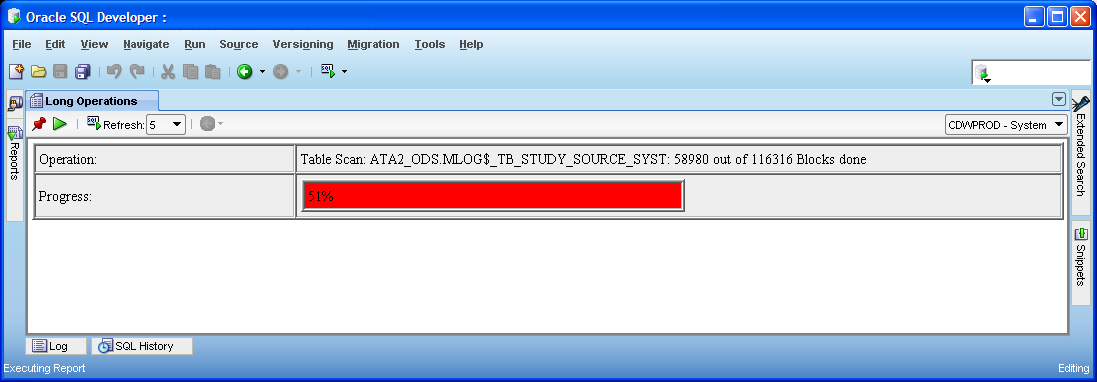
Here is an example of the report running with 1 long operation (click to enlarge):
If you have more than 1 long operation running at the same time they will stack on top of each other and a scrollbar will appear at the right side of the results window. If no long operations are running then the message No Long Operations Active will be displayed.
I think this is what is used to render the HTML reports - research ongoing though: oracle.adf.view.rich.component.rich.output.RichOutputFormatted
This indicates support for the following tags:
<br>
<hr>
<li>, <ol>, <ul>
<p>
<b>
<i>
<tt>
<big>
<small>
<pre>
<span>
<a>
Capabilities I have confirmed so far:
TABLE
Inline CSS via the STYLE attribute
Capabilities I can't get to work so far:
<style type="text/css">
Collection of information relating to creating your own Oracle SQL Developer extensions.
SQL Developer Main Page
JDeveloper Extension SDK
SQL Developer SDK on wiki.oracle.com
Home page: http://wiki.oracle.com/page/SQL+Developer+SDK
SQL Developer SDK How Tos (Oracle Wiki): http://wiki.oracle.com/page/SQL+Dev+SDK+How+Tos?t=anon
How to create a Java Defined Extension: http://wiki.oracle.com/page/SQL+Dev+SDK+How+To+Create+a+Java+Defined+Extension
OTN
Oracle SQLDeveloper Examples - http://www.oracle.com/technology/products/database/sql_developer/files/obe.html
Oracle SQL Developer - Extensions Exchange - http://www.oracle.com/technology/products/database/sql_developer/files/extensions.htm
Third Party Extension
Oracle SQL Developer extensions by Fourth Elephant Software - http://www.fourthelephant.com/sqldeveloper/download/
Outdated Info
Write Your Own Extension to SQL Developer by Sue Harper - http://sueharper.blogspot.com/2006/05/write-your-own-extension-to-sql.html
Let's Get Started with an Extension for SQL Developer (in 10 Steps) - http://sueharper.blogspot.com/2006/08/lets-get-started-with-extension-for.html
References:
http://web.archive.org/web/20091115145505/http://wiki.oracle.com/page/SQL+Dev+SDK+How+Tos
http://web.archive.org/web/20091115193013/http://wiki.oracle.com/page/SQL+Dev+SDK%3AHow+To+create+an+editor+for+a+Node
For a while Google has offered a service where you can send it a URL and get back a chart. It seems all good ideas at Google get squashed so this will only be guaranteed to be available until April 2015. But until then it can be a quick/easy way to get a chart into a SQL Developer User Defined Report using the PL/SQL DBMS_OUTPUT type.
SQL Developer has a few simple charts and gauges available already but this API can give you ability to create Line, Bar, Pie Charts, Map, Scatter, Venn Diagrams, Radar Charts, QR Codes and Meters.
How it works
Build a url and submit it as an IMG tag in your web page. Google will generate a PNG image and return it as a response to the http image request. Your SQL Developer installation must be able to hit the chart.googleapis.com URL so internet access is required when you generate your report.
The general form is:
https://chart.googleapis.com/chart?cht=<chart_type>&chd=<chart_data>&chs=<chart_size>&...additional_parameters...
So when I added this line to the source of this page:
<img src="http://chart.googleapis.com/chart?chs=250x100&chd=t:60,40&cht=p3&chl=Hello|World">
We get this returned as a result:
Pretty cool huh? It is an easy way to dress up your boring lists of facts and figures, and free to boot.
So how do we use this in PL/SQL?
Well if we're outputting HTML in a PL/SQL User Defined Report, we just have to take some time to build the URL. Here is some code to do something silly, but it will illustrate the point. We are going to create a pie graph to show the percentage of users that are using each tablespace as default. I am using my handy Developer Days VM as a source.
An example of how to create a PL/SQL DBMS_OUTPUT report is here. Use the following source code for this example:
-- David Mann
-- http://ba6.us
-- 28-JUL-2012

-- Simple Google Chart Example
-- Requires access to DBA_USERS
-- Spool output to file and view with browser
-- or use SQL Developer PL/SQL DBMS_OUTPUT report type

--SET SERVEROUTPUT ON
DECLARE
  -- Vars we will use to build the URL
  chart_url   VARCHAR2(2048);
  chart_data  VARCHAR2(2048);
  chart_label VARCHAR2(2048);
  -- Skirt around SQLPLUS/SQLDev substitution variable issues by using this
  amper CHAR(1) := CHR(38);
BEGIN
  FOR cur IN
  (SELECT
      DEFAULT_TABLESPACE,
      COUNT(*) AS CNT
    FROM
      DBA_USERS
    GROUP BY
      DEFAULT_TABLESPACE
    ORDER BY
      2 DESC)
  LOOP
    -- Prepare Label list for URL
    chart_label := chart_label || cur.DEFAULT_TABLESPACE || '%20('||cur.CNT||')|';
    -- Prepare Data list for URL
    chart_data := chart_data || cur.CNT || ',';
  END LOOP;
  -- Remove the last delimeter from the string
  chart_label := SUBSTR(chart_label,1,LENGTH(CHART_LABEL)-1);
  chart_data  := SUBSTR(chart_data,1,LENGTH(CHART_DATA)  -1);

  -- Build the URL
  chart_url := chart_url || 'http://chart.apis.google.com/chart?chs=400x300';
  chart_url := chart_url || amper || 'cht=p3';
  chart_url := chart_url || amper || 'chd=t:' || CHART_DATA;
  chart_url := chart_url || amper || 'chds=a';
  chart_url := chart_url || amper || 'chdl=' || CHART_LABEL;
  chart_url := chart_url || amper || 'chtt=Default+Tablespace+Usage+Counts';
  chart_url := chart_url || amper || 'chf=a,s,000000|bg,lg,0,EFEFEF,0,BBBBBB,1';
  chart_url := chart_url || amper || 'chp=3.14';
  chart_url := chart_url || amper || 'chdlp=b';


  DBMS_OUTPUT.PUT_LINE('URL Detail');

  DBMS_OUTPUT.PUT_LINE('Chart Data: '||chart_data||'');

  DBMS_OUTPUT.PUT_LINE('Chart Labels: '||chart_label||'');

  DBMS_OUTPUT.PUT_LINE('Chart URL: '||chart_url||'');

  DBMS_OUTPUT.PUT_LINE('Our Graph!');
  DBMS_OUTPUT.PUT_LINE('');
END;
And here is what it will look like when you run it in SQL Developer (Click to enlarge):
Tips
References